

So in my last two posts I have been writing about my amateur analysis of what regular season performance statistics actually correlate to playoff success. I got some fairly decent results, I think.
The only extra review I did since my last post was to run one more statistic; 5v5 "Close" Corsi percentage. "Close" is defined as when the game is within 1 goal in the 1st or 2nd period, or tied in the 3rd period. I thought that could be a good one, because teams play differently depending on the score: they'll sag back on defense with the lead, and attack more when trailing (particularly in the 3rd period). I thought controlling for those factors would produce a better result.
Turns out, it did. Here's one last visual chart of correlation factors for each regular season statistic.

Using 5v5 Corsi "Close" gives a slight boost to the correlation factor over plain old 5v5 Corsi or Fenwick.
So what to do next?
At this point, I identified 4 robust statistics; total goal difference, Corsi close, PK, and save percentage as leading indicators. Then, I used Excel to a run a 4-variable regression using the last 5 years of the NHL data that produced the chart above. Giving that I have not done this stuff since Econometrics my senior year of college, I'd probably bungle an in-depth explanation of everything that means. For these purposes, it suffices to say that this process spits out a formula for a linear trend line into which you can plug raw data, then get a predicted number of playoff wins.
Armed with this equation, I then went back over the last 5 years and did just that.


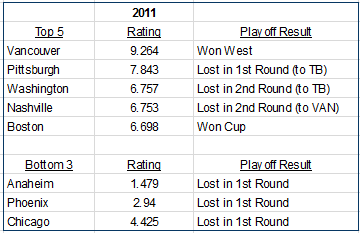

In many ways, these results turned out better than I expected. With the sole exception of the 2010 Flyers, 9 out of 10 Stanley Cup Finalists were top-5 ranked team according to my formula. In 3 out of 5 years, the team ranked 1st or 2nd in these rankings actually won the cup. While top-5 teams occasionally do bomb out in the first round, in most cases the loss is to another top ranked team or there is a mitigating factor; 2014 St. Louis entered the postseason in horrible slump, 2012 Pittsburgh had a mental collapse against the hated rival Flyers, and 2011 Pittsburgh was playing without injured Malkin and Crosby... These are pretty solid results!
On the flip side, being in the bottom-3 spells nearly certain doom. 13 out of 15 bottom-3 teams lost in the first round. The 2010 Montreal squad was the only team that did anything of note from such a low position.
Okay, so modeling the past isn't the hard the part. What does the formula say for the future? I ran it again using NHL statistics from this season, as of today. Here are the results:

So there it is. There's Chicago and then a cluster of comparable teams. Are the two eventual Stanley Cup finalists found in that top-5, as has been the case the last 4 consecutive seasons? At the other end, some may be surprised to see the Islanders at second-to-bottom, given all the fans they've won over with their play this year. I can tell you they're down there because their penalty kill and team save percentage are clearly the worst of playoff teams. I will update these numbers at the end of the season to get final ratings, at which time I'll have to ask myself how much confidence I want to put into my magic formula!
Nevertheless, I'm pretty pleased with the end result of my little investigation.
No comments:
Post a Comment